Getting started with moonstone
Moonstone can be used in two different ways:
By command-line
Warning
This feature is going to change in the future and is still under construction
A list of built-in scripts for analysis is available and can be used by command line. They are built from the different moonstone modules described below.
Please refer to the help section of the command-line tool for more information:
$ moonstone --help
In Python
Moonstone provides a list of modules to perform the different steps of your analysis. In this part, you will find a detailed description of each module.
Warning
This part is under construction and will be completed while updating each modules
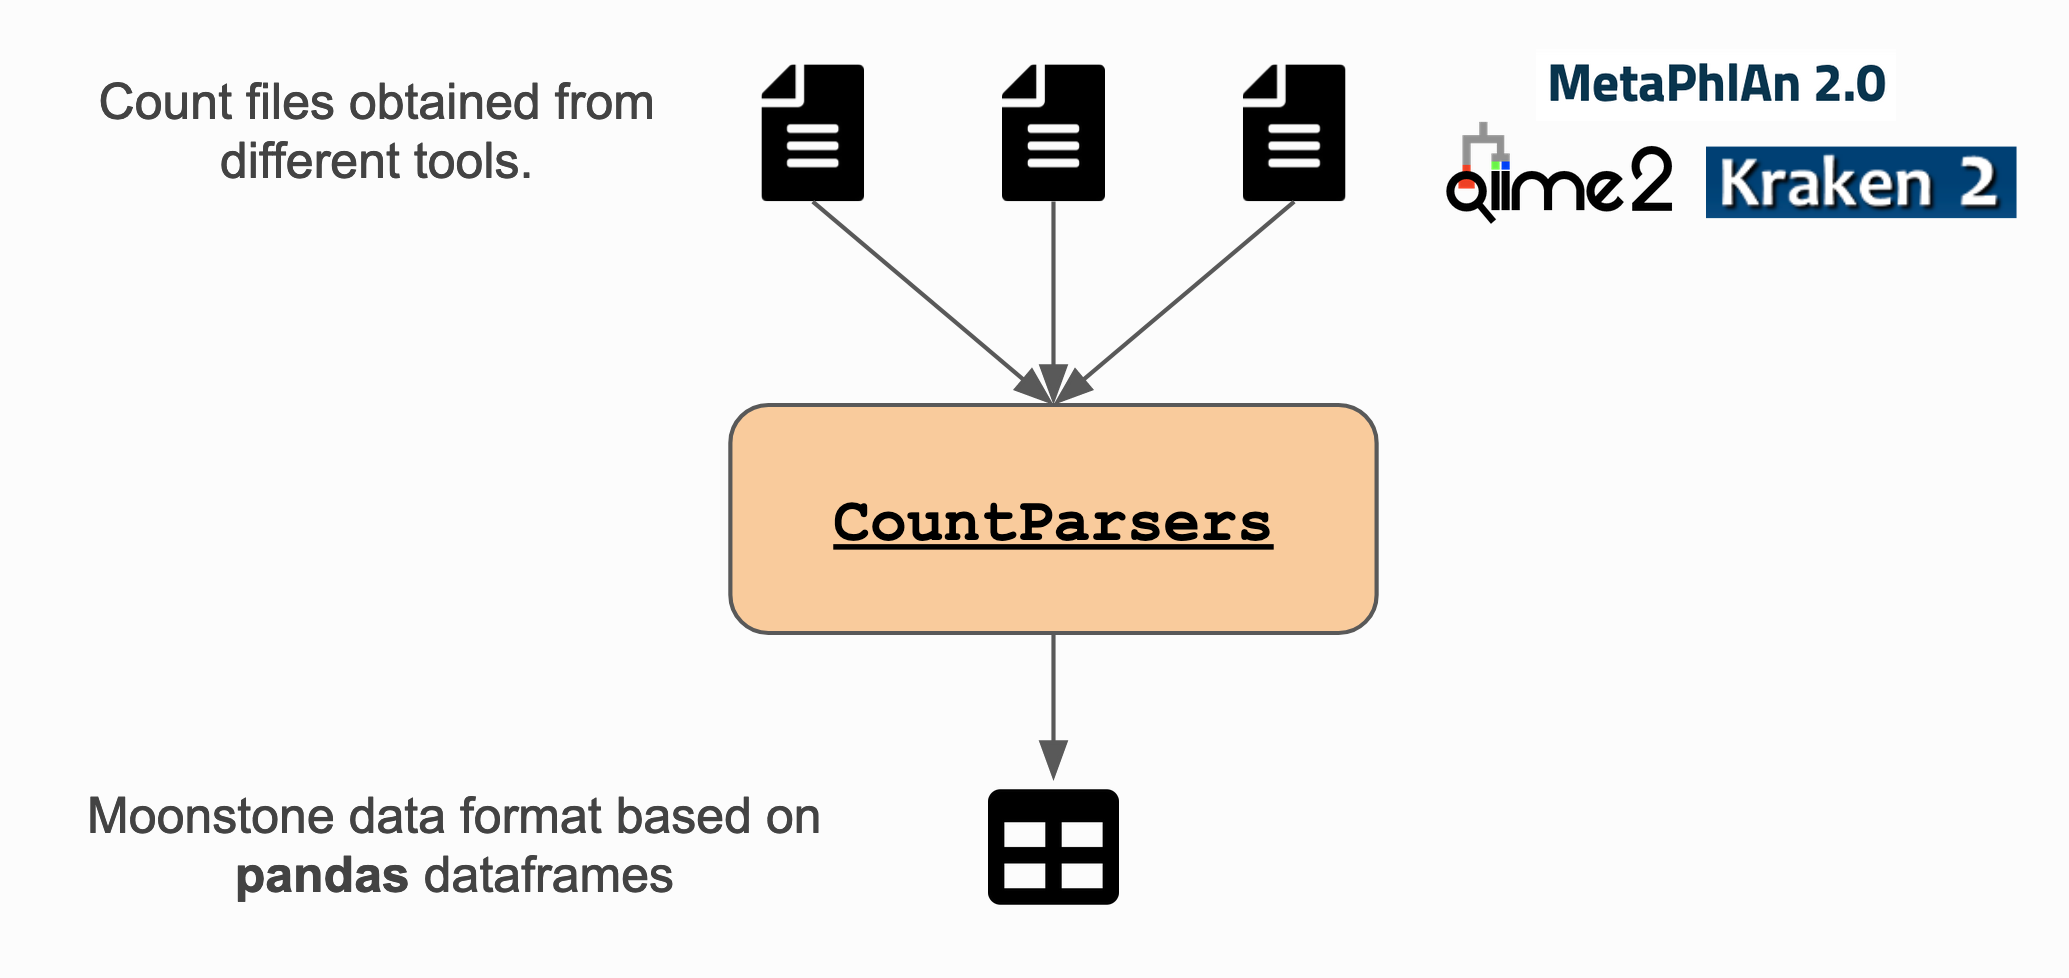
Parsers
A crucial step of every analysis is to import the data. Here the aim is to be able to import data from many different sources and format them in a homogeneous configuration using pandas dataframes.
Note
The parsers module can be described as the ETL procedure of moonstone.
How does it work?
The parsers are made in a way you do not have to care about the different options for parsing with pandas.read_csv:
from moonstone.parsers import YourFavoriteParser

parser = YourFavoriteParser("/path/to/your/favorite/file.csv")
df = parser.dataframe
Note
Every parsers works more or less in the same way, by accessing the parsed result through the dataframe
property of your Parsers instance.
What format Moonstone can handle?
Detailed information about the different parsers can be found in the API documentation about api_parsers. In brief, parsers are available for:
Note
Table example represent moonstone data format once the data is parsed.
Simple count matrices (columns being samples, rows being items)
index |
sample-1 |
sample-2 |
sample-3 |
|---|---|---|---|
gene-1 |
22 |
0 |
35 |
gene-2 |
35 |
29 |
56 |
Taxonomy counts matrices
indexes |
columns |
|||
|---|---|---|---|---|
kingdom |
phylum |
class |
sample-1 |
sample-2 |
Bacteria |
Firmicutes |
Clostridia |
35 |
56 |
Note
Multi-indexes are used to represent taxonomy counts in order to facilitate grouping at the chosen level.
Metadata (table with each row containing information about one sample)
index |
age |
sex |
smoker |
|---|---|---|---|
sample-1 |
22 |
f |
y |
sample-2 |
35 |
m |
n |
Cleaning and Transformers
It is not rare to have the necessity to clean up a bit the data you wish to analyse before analysis. This is often the case for metadata that are often manually obtained through a spreadsheet without any specific constraints leading to mistakes and inconsistency in the matrix.
As part of the Parsers module, some cleaning and transforming operations can be applied. Here are some examples of operations you might need to do:
Transform a
stringto snakecase format (particularly useful to make sure sample IDs are identical between counts and metadata)Remove trailing spaces from a
string.Group under a common name different values representing the same thing (e.g. M, m and male for sex).
Note
More details about available operations can be found in the API documentation about api_parsers.
Filtering
You might need to filter your data for several reasons such as poor quality or absence of metadata.
Note
More details about available operations can be found in the API documentation about Filtering.
How does it work?
For any Filtering module, you can obtained the filtered dataframe through filtered_df property
of the Filtering instance:
from moonstone.filtering import NoCountsFiltering

filtering_instance = NoCountsFiltering(df)
filtered_df = filtering_instance.filtered_df
For some other Filtering classes, you might need to give some parameters:
from moonstone.filtering import NamesFiltering

# Select rows with indexes corresponding to gene1 and gene2
filtering_instance = NamesFiltering(df, ['gene1', 'gene2'], axis=0, keep=True)
filtered_df = filtering_instance.filtered_df
What filtering classes?
Moonstone provides several means of filtering your data (non exhaustive list):
remove rows with no data.
filtering by mean : allows you to filter out the items with poor mean read count.
select/remove rows/columns by names
select/remove taxa from Taxonomy dataframe (MultiIndex)
Note
To run different filtering methods on your data, the filtering must be run one after the other. The filtered dataframe generated by the previous filtering needs to be given as input to the next filtering.
Normalization
You might need to normalize your data in order to perform comparisons and analysis.
Note
More details about available operations can be found in the API documentation about Normalization.
How does it work?
from moonstone.normalization import YourFavouriteNormalization

normalization = YourFavouriteNormalization(your_df)
df = normalization.normalized_df
Note
You might have to provide extra parameters during instantiation of the class. Look at Normalization for more information.
Analysis
How it works?
from moonstone.analysis import DifferentialAnalysis

# instantiation
analysis_instance = DifferentialAnalysis(df, metadata_df)
analysis_instance.differential_analysis_by_feature(features, type_of_features, test_to_use, correction_method_used)
Note
The way analysis instances work will change using a defined common way of performing analysis.
Plot
At any point of your work on your data, Moonstone provides standard plots to visualize your data and metadata.
Note
More details about available operations can be found in the API documentation about Plot.
How does it work?
To plot your data, you need to instantiate a PlotCountsStats object with a pandas dataframe generated with moonstone (at any steps)
from moonstone.plot import PlotCountsStats

# instantiation
plot_instance = PlotCountsStats(df)

# call one (or more) plotting method(s)
plot_instance.your_favorite_plot()
plot_instance.another_of_your_favorite_plot()
Likewise, for the metada
from moonstone.plot import PlotMetadataStats

plot_instance = PlotMetadataStats(metadata_df)
plot_instance.your_favorite_plot()
Arguments can be given to any plotting methods of both classes,
… to override the standard parameters of plotting of the method with the argument plotting_options.
… or to ask for a html file to be generated with the argument output_file
… or even to ask not to show the plot with the argument show set to False
plotting_options={'traces': {'marker_color' : 'red'}, 'xaxes': {'tickangle' : 90}}
plot_instance.your_favorite_plot(plotting_options=plotting_options, output_file='mygraph.html', show=False)
What can be plotted with this module?
Plot available for data :
the mean distribution of your data (plot_mean)
…tbc…
Plot available for metadata :
the age distribution of patients (whose samples are originated from) (plot_age)
the sex distribution of patients (whose samples are originated from) (plot_sex)
etc. (plot_other)